Lytec Reports Features
Lytec provides everything from comprehensive billing, to scheduling. It delivers accounts receivable management, automatic recall tracking, document scanning, tremendous security, and much more.
Lytec reports can be created or customized to match the needs of every practice. With the powerful report writer, we can help you pull the data you need to manage your practice efficiently.
Lytec Reporting Features:
- Identifies the trends of your practice through diagnosis and procedure code analysis.
- Tracks profitability of your referring physician network.
- Summarizes information about the financial status and service performance of practice
- Summarize all account activity—charges, payments, and adjustments—with the Practice Analysis report. This report is excellent for tax and accounting purposes or for comparisons.
- Analyzes the managed care costs for services provided against the insurance reimbursement received through contract services.
- Compares the difference between charges billed to an insurance company and the amount reimbursed from the insurance company.
- Ability to visually represent reports using graphs or pie charts
- Tracks the number of inventory items you sell.
To get more information Call 800-955-0321 or click here
Labels
Address Labels
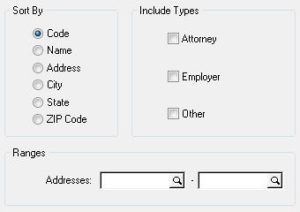
This report allows you to print mailing labels for Attornies, Employers, Other, or any combination of these categories.
Insurance Company Labels
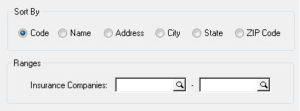
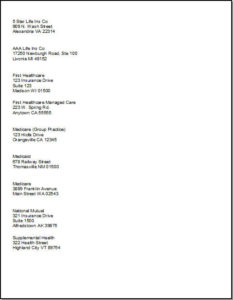
This report provides mailing labels for insurance companies entered in Lytec. You can filter for a specific company or a range of companies.
Patient Labels
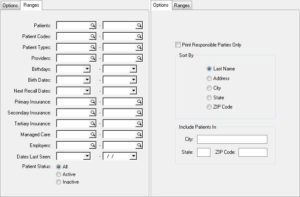
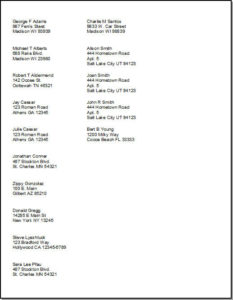
This report provides patient labels for charts or mailings. You can choose to isolate the report to a specific city or state, and you can also filter by patients, birth dates, insurances, and more.
Custom Reports
Appointment Collections
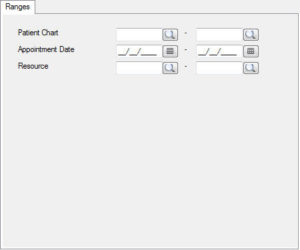
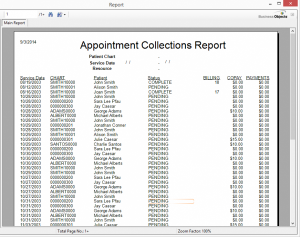
The Appointment Collections report provides a list of visits that still have an outstanding balance. The list includes details such as the date of service, chart number, patient name, appointment status, billing number, copay amount, and payment amount. The report also provides a total on the last page.
Categorized Transaction Journal
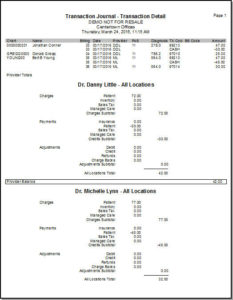
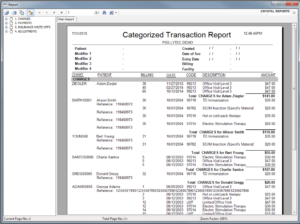
The Categorized Transaction Journal report provides a list of transactions categorized by charges, payments, and adjustments. The patient’s are listed within each category and then broken down by billing number to see what was charged. This portion includes the date of service, code, description, and amount of the charge. Payments and adjustments are similarly broken down and then totaled.
Categorized Transaction Journal Multiple Practice
The Categorized Transaction Journal Multiple Practice includes data from the Categorized Transaction Journal report, but also includes the option to analyze more than one practice.
Charges and Payments by Patient Code
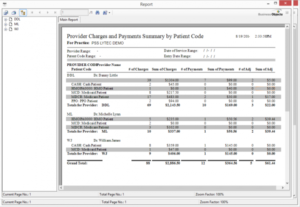
The Charges and Payments by Patient Code report provides a summary of charges, payments, and adjustments by the type of patient (PPO/Medicare/Medicaid/Cash, etc). It is broken down by provider, so you can see which provider sees which types of patients, the total charges, payments, and adjustments for those patient types, and the totals of these for each provider. The report also provides a grand total of these categories for all providers.
Charts with Their Billing Numbers
The Charts with Their Billing Numbers report provides an Excel file containing a list of chart numbers with each of their billing numbers.
Date of Service Listing
The Date of Service Listing report provides a list of all dates of service, followed by the chart number and patient name of each patient seen that day. The report also provides a total number of visits for each date of service, and then a total for the report. You can search for all dates, or you can narrow it down by filtering the report for a specific date or date range.
Deposit Report
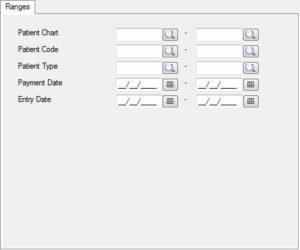
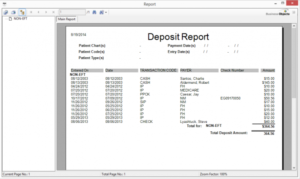
The Deposit Report provides a list of all payments received for a specific date or date range. The payments are organized by payment type and includes the date entered, the transaction type, the payor (or patient), the check number (if applicable), and the amount.
Facilities Charges by Insurance
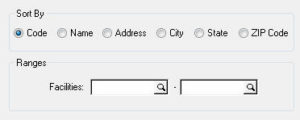
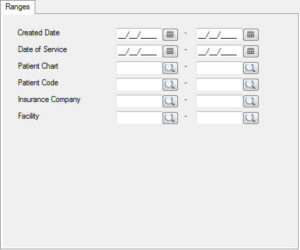
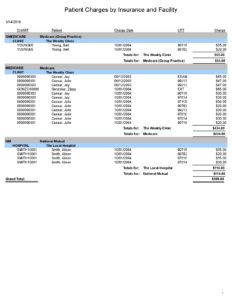
The Facilities Charges by Insurance report provides a summary of patient charges organized by Insurance and then broken down by facility. The report provides the patient chart number, name, charge date, CPT code, and the charge amount. After each insurance, it will provide a total for that insurance, and also a total for each facility within that insurance category.
Monthly Procedure Code Analysis
*No Filters*
The Monthly Procedure Code Analysis report creates an Excel file that provides information on which transaction codes were used within each month. It will display the procedure code, description, default charge, how many units were billed for each month, the total number of units billed for that procedure, and then the total amount charged for that procedure.
Patient Diagnosis Codes
The Patient Diagnosis Codes report provides a list of patients that have been billed with a diagnosis code. It is organized by patient, and then broken up into the individual dates of service. The report allows for up to 12 diagnosis codes. You are also able to filter the report to only view one code, or a specific date range of dates of service.
Patient Email by Appointment Range
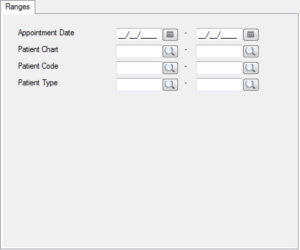
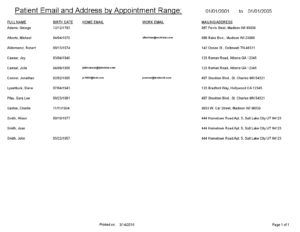
The Patient Email by Appointment Range report provides a list of patients that were seen within a specific date range. It lists their name, date of birth, home email, work email, and mailing address.
Patient Insurance by Date Last Seen
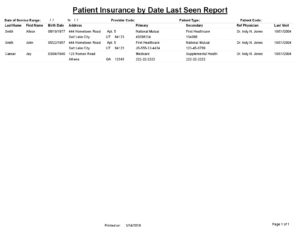
The Patient Insurance by Date Last Seen report provides a list of patients seen in a specific date range and the insurances that were billed. The report includes patient name, birth date, address, primary insurance, secondary insurance, referring physician, and the date of their last visit.
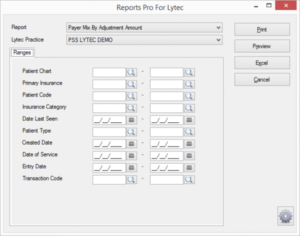
Payer Mix by Charge Amount
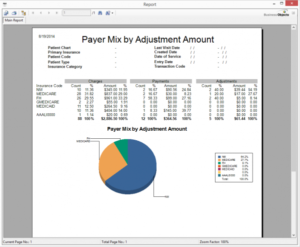
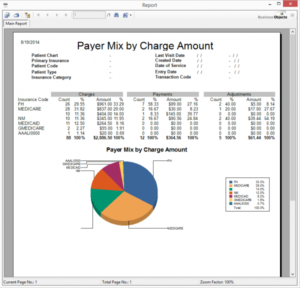
The Payer Mix by Charge Amount report provides details on how much is being charged to each insurance. The report is broken up into two sections: a numerical chart of charges, payments, and adjustments for each insurance, and a pie chart of the charge amounts to each insurance. This is a great report to see which payors are being charged the most.
Payer Mix by Insurance Category
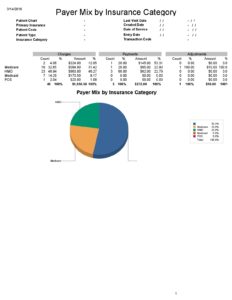
The Payer Mix by Insurance Category report shows the percentages of payments from each insurance category. This is important to see the insurances that contribute the most to your income.
Payer Mix by Patient Count
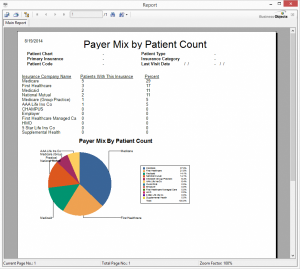
The Payer Mix by Patient Count report provides information on how many patients are assigned to each insurance company. The report shows the information in a numerical list, and also provides a pie chart to show the percentage of patients with that insurance.
Payer Mix by Payment
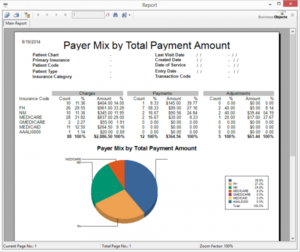
The Payer Mix by Payment report shows the payment amounts received for each insurance company. It also includes the total charges, as well as the total adjustments for each insurance. It provides the information in a numerical chart, and also includes a pie chart of percentage of income from each insurance company.
Payer Mix by Visit Count
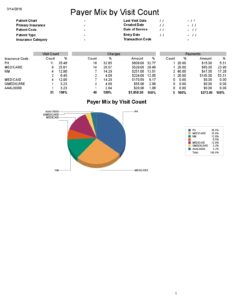
The Payer Mix by Visit Count report shows the number of patient visits for each insurance company. The report also includes the total charges for each insurance, and the total payments for each insurance. It shows the above information in a numerical chart, and also provides a pie chart of the percentage of patient visits for each insurance company. This is a good report to run if you want to see how each insurance company compares in the number of total patient visits.
Payment Totals Report
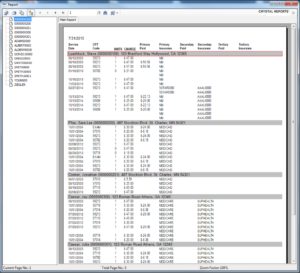
The Payment Totals Report provides a list of all charges organized by patient chart number. The report includes the patient name, chart number, address, dates of service, what was charged at those appointments, and what was paid by the primary, secondary, or tertiary insurances. The last page also calculates a report total for charges and payments in each category.
Physician Quality Reporting Export
The Physician Quality Reporting Export pulls information into an Excel file that lists Medicare patients’ visits. It provides information such as patient name, chart number, date of birth, visit date, diagnosis, and procedure codes.
Procedure Code Analysis Detail
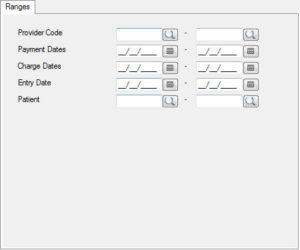
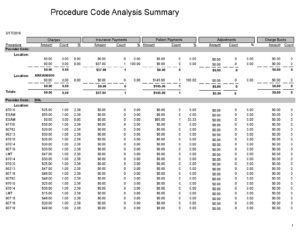
The Procedure Code Analysis Detail is organized by provider, and then further broken down by location. In each location, the procedure codes billed are listed and the report calculates the total charges and units billed for each procedure code. This differs from the Procedure Code Analysis Summary report by listing each procedure code that was billed as a new line, regardless of if that code has already been listed for that location. For example, if 99213 was billed 4 time in one location, it will be visible on this report as 4 separate lines, each one unit. It further details the insurance payments on these codes, as well as patient payments, adjustments, and charge backs. Each calculation is detailed with amount, units, and percentages. Totals are available for each location and for the entire report.
Procedure Code Analysis Summary
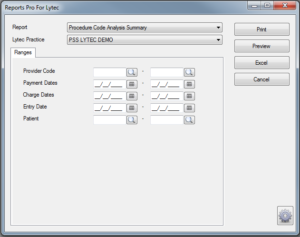
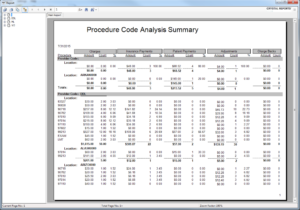
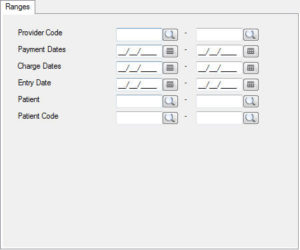
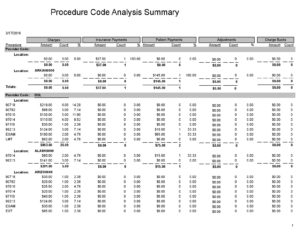
The Procedure Code Analysis Summary report provides all the information from the Procedure Code Analysis Detail report, but joins together any procedure codes billed more than once for the same location. For example, this report will only show one line for 99213, even if it was billed several times. The units column will show how many times the code was billed.
Procedure Code Ledger
The Procedure Code Ledger report provides an Excel file of charges, listed by billing number. The following information is available on this report: Provider code, billing number, chart number, patient name, date of birth, age, SSN, date created, date of service, entry date, facility, transaction code, units, charge, type of insurance, patient payment, date of patient payment, primary/secondary/tertiary insurance, primary/secondary/tertiary insurance charges/payments/adjustments, and the amount due.
QCH Report
The QCH Report is an extremely detailed report on transactions that have been entered, but without the patient information. This report provides the following details for each transaction: provider code, provider name, date of service, insurance code, insurance type, insurance name, billing number, transaction code, transaction detail, transaction type, cpt code, cpt description, location code, location name, entry date, charge, patient payment, insurance payment, adjustments, insurance adjustment, and adjustment credit. This a good report if you’re looking for ledger details without the patients’ personal information.
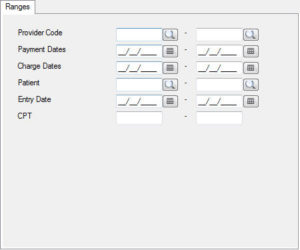
Reimbursement and Charge Activity by Facility Detail
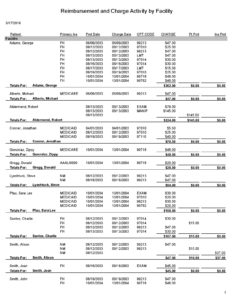
The Reimbursement and Charge Activity by Facility provides information on charges and payments organized by each provider, and then further broken down by facility. Under each facility, it is further organized by patient. It shows the total charges for each patient, along with the patient payments and insurance payments. It provides totals for each patient, and then the facility as a whole. It also shows the provider totals, and the report totals. This is a great report to see how different providers compare in terms of amounts charged out of each facility, and the payments received for those charges.
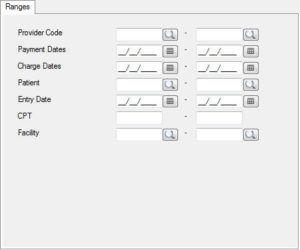
Reimbursement and Charge Activity by Facility
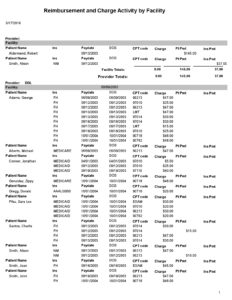
The Reimbursement and Charge Activity by Facility provides information on charges and payments organized by each facility. You can filter for one specific facility, or run the report without a filter for a comparison of all facilities. Under each facility, it is further organized by patient. It shows the total charges for each patient, along with the patient payments and insurance payments. It provides totals for each patient, and then the facility as a whole. This is a great report to see how different facilities compare in terms of amounts charged out of each facility, and the payments received for those charges.
Referring Physician Analysis
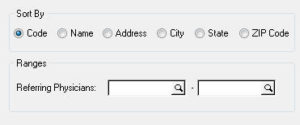
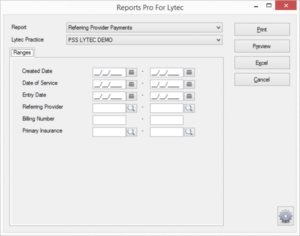
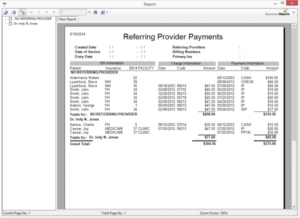
A report which shows payments received by referring provider. Contains Patient Name, Primary Insurance, Billing Number, Facility, Date of Service, Charge Amount, and Payment Amount. If you already have Reports Pro installed.
User Productivity Report
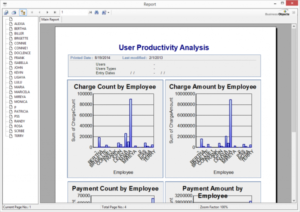
The User Productivity Report includes four charts that allow you to see the A/R productivity for each Lytec user. The different charts include the number of charges entered, the total charge amounts entered, the number of payments taken, and the total sum of all payments taken, showing different bars for each employee. The final page of the report provides the same information written out. Each user has a row that indicates how many charges were entered, the total amount of those charges, the number of payments entered, and the total amount of those payments. This portion of the report also includes the adjustments entered and the total of those adjustments. This is a good report to run to compare A/R activities of each Lytec user.
Need more info?
Call us at 800-955-0321
Call 800-955-0321 or Click below
Download a Demo
Free trial software and online demos
Try a Free Demo
Schedule Live Demo
Let our experts show you our solutions


